
Chrome MV3 · CSS inspector
Rudra Inspect
A side-panel CSS inspector for any page — fonts, colors, headings, contrast, and a live element inspector. Built for design QA and client audits without DevTools archaeology.
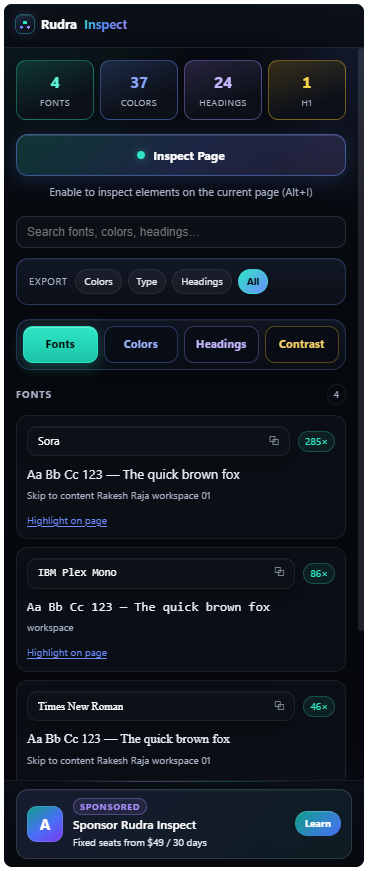
Problem → solution
Problem: Auditing a client site means opening DevTools, hopping panels, copying hex codes, and losing context every time you switch tabs. Heading hierarchy and contrast checks are scattered across tools.
Solution: One MV3 side panel that scans the active page on demand — typography, palette, heading structure, and contrast pairs — with highlight-on-page and export to a portable design kit.
The inspector injects only when you open the panel on that tab. Page content stays local; nothing is uploaded to our servers for the core inspect workflow.
One panel, four focused sections
Tabbed sections keep the UI calm — you see one audit at a time instead of a wall of DevTools panels.
Fonts
Scans font families in use, with sizes and weights. Search, filter, and highlight every element using a family on the page.
Colors
Collects text, background, and border colors. Click a swatch to highlight matches and copy values for handoff.
Headings
Audits heading tags (H1–H6), flags skipped levels, and shows the outline structure for SEO and accessibility review.
Contrast
Samples foreground/background pairs and reports WCAG contrast ratios so you can catch accessibility issues early.
Built for operators, not engineers only
| Capability | Manual DevTools | Rudra Inspect |
|---|---|---|
| Font inventory across page | ✗ | ✓ |
| Color palette summary | ✗ | ✓ |
| Heading outline audit | ✗ | ✓ |
| Contrast ratio checks | ✗ | ✓ |
| Highlight matches on page | ✗ | ✓ |
| Live element inspector overlay | ✓ | ✓ |
| Export design kit | ✗ | ✓ |
| On-demand inject (no always-on script) | ✗ | ✓ |
Everything it does
Inspect Page
One-click scan of the active tab. Injects the inspector script on demand — only when you use the panel.
Element inspector
Hover and click elements on the live page. See computed styles, box model, and dimensions in the overlay.
Highlight on page
Pick a font family or color from the list and highlight every matching element without manual selectors.
Export design kit
Export fonts, colors, and heading data as JSON or copy-friendly text for client handoff and design systems.
Local-first processing
Page scans run in your browser. Core inspect data is not uploaded to rakesh.in servers.
MV3 side panel
Stays beside the page you are auditing. Reconnect flow if the tab navigates or the content script needs a refresh.
Built with
The extension uses a service worker bridge to inject the inspector into the active tab when you open the side panel. React drives the panel UI with section tabs; the content script handles page highlights and the element picker overlay.
Who it's for
Designers & QA
Quick palette and typography audits on staging sites without learning DevTools panel layouts.
Agencies & freelancers
Client site reviews, contrast checks, and heading structure reports from one exportable panel.
WordPress builders
Audit Elementor or block themes on the live front-end while keeping wp-admin in another tab.
Front-end developers
Faster than copying from Computed styles — especially when you need a full inventory, not one element.